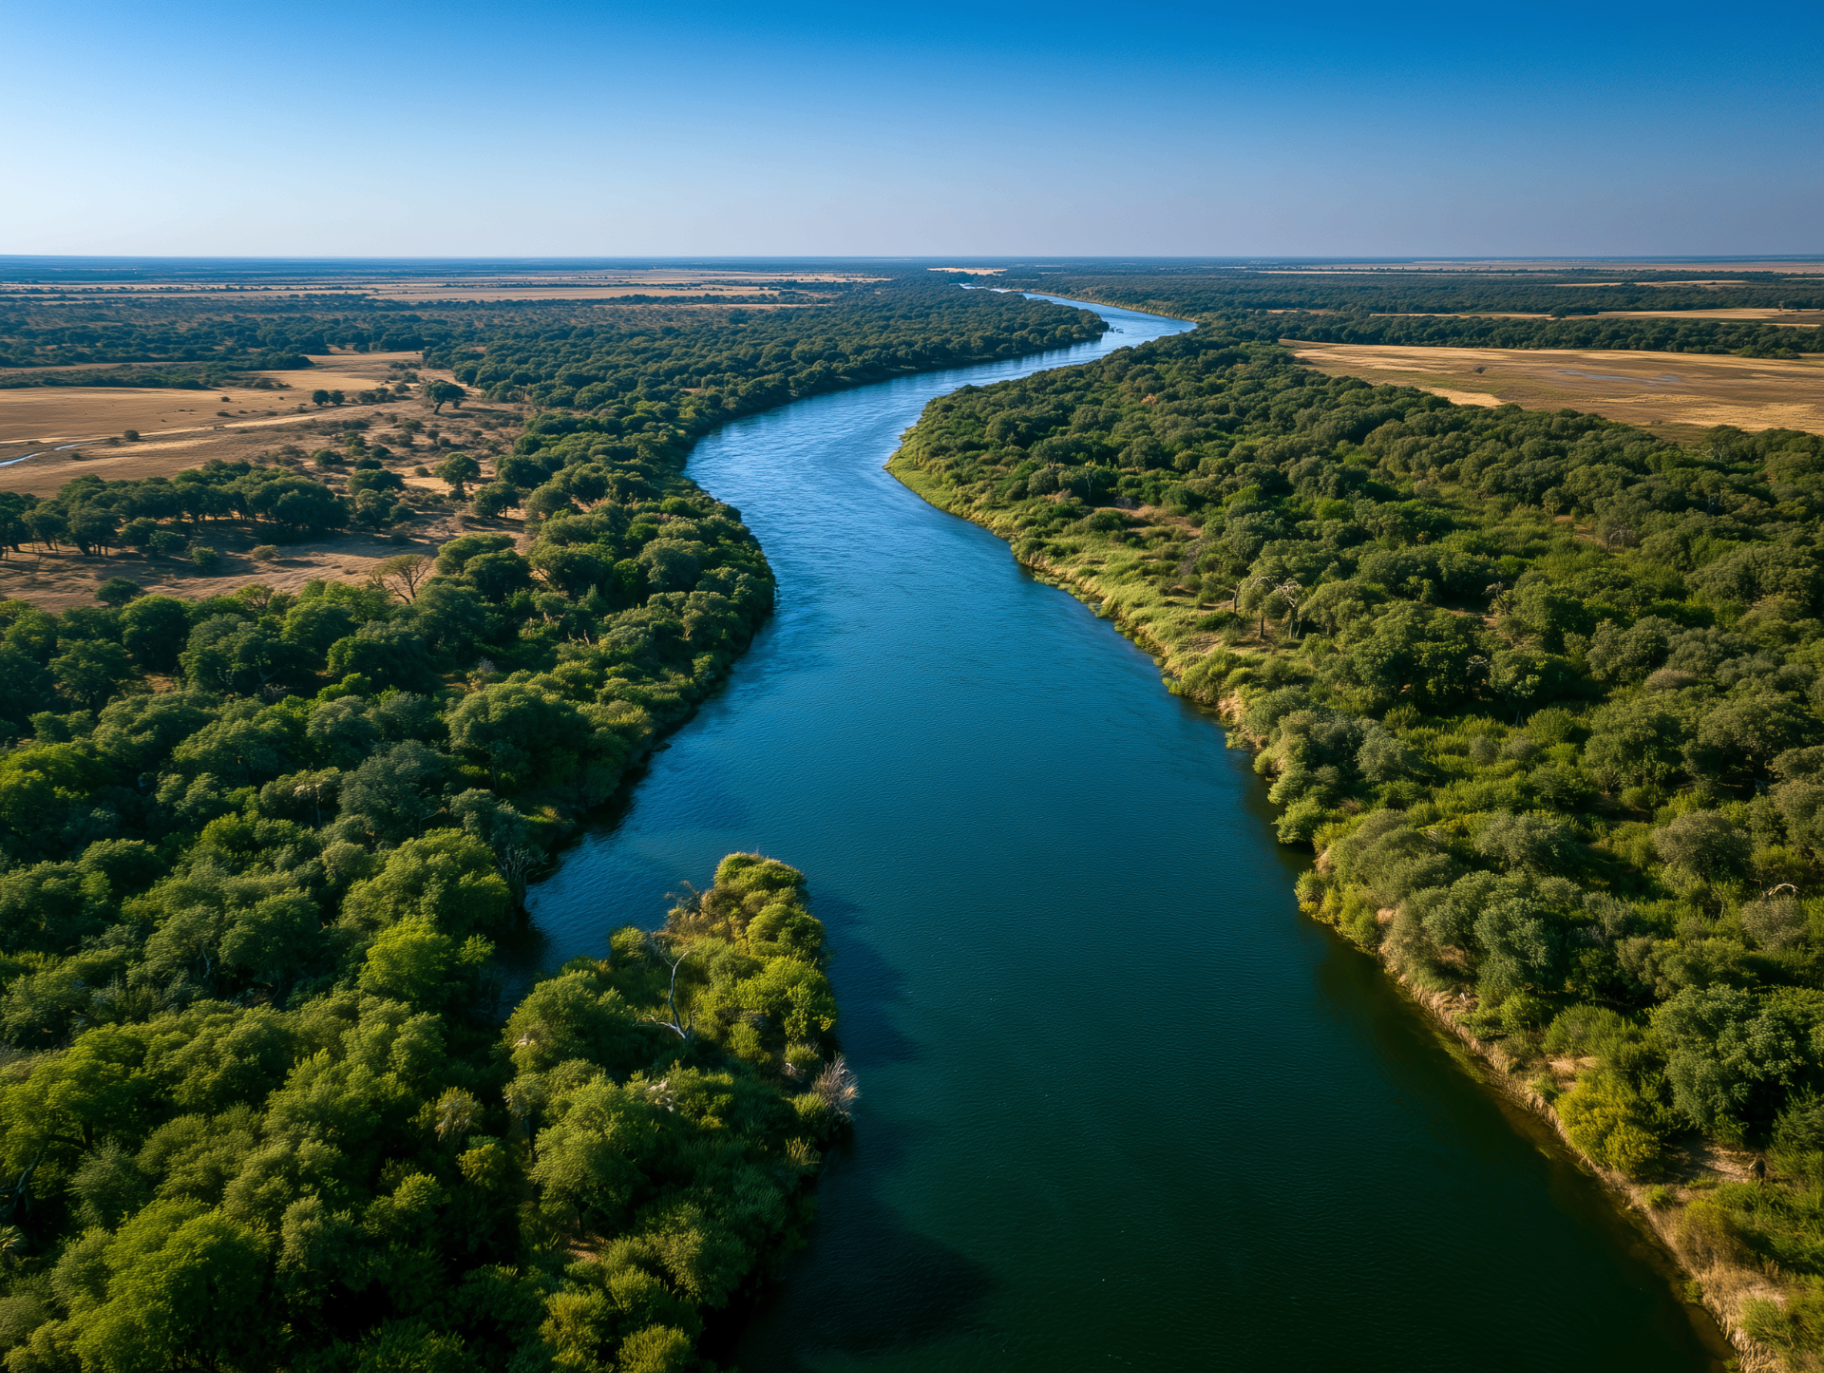
Fresh Water
Every bottle of beer brewed, every kilowatt generated, every harvest made, every export sent, flowed through her.
Net: Environmental impact to aquatic systems
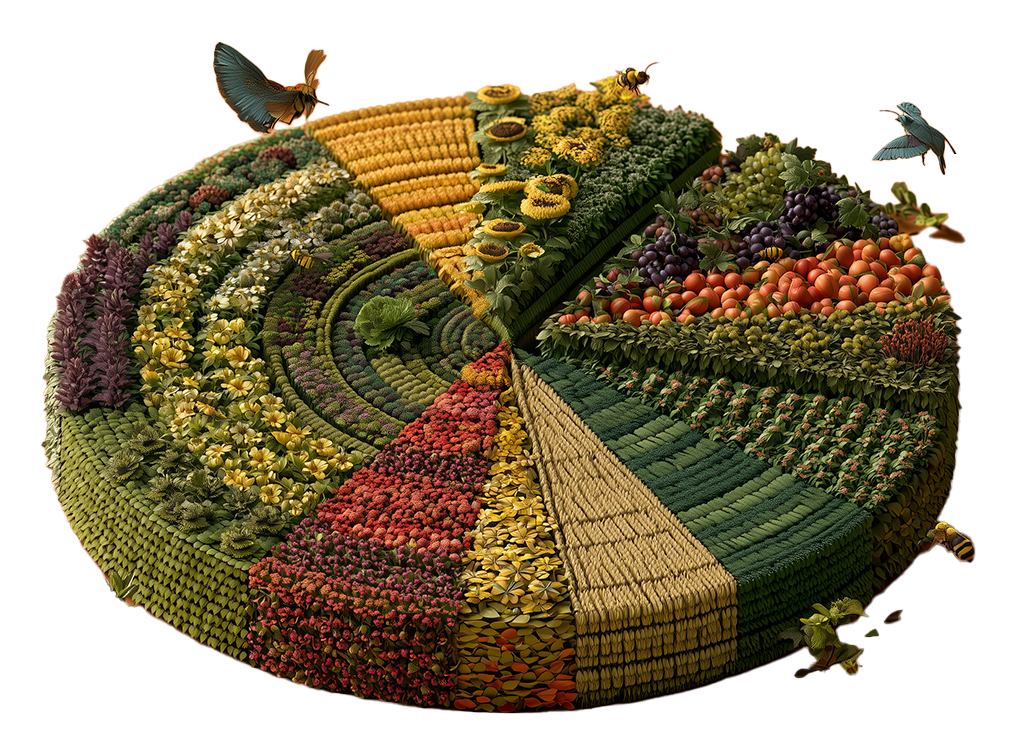
Pollinators
Bees, birds, and bats turning up to every farm, every dawn, every day of the year.
Net: Systemic loss of pollinator biodiversity
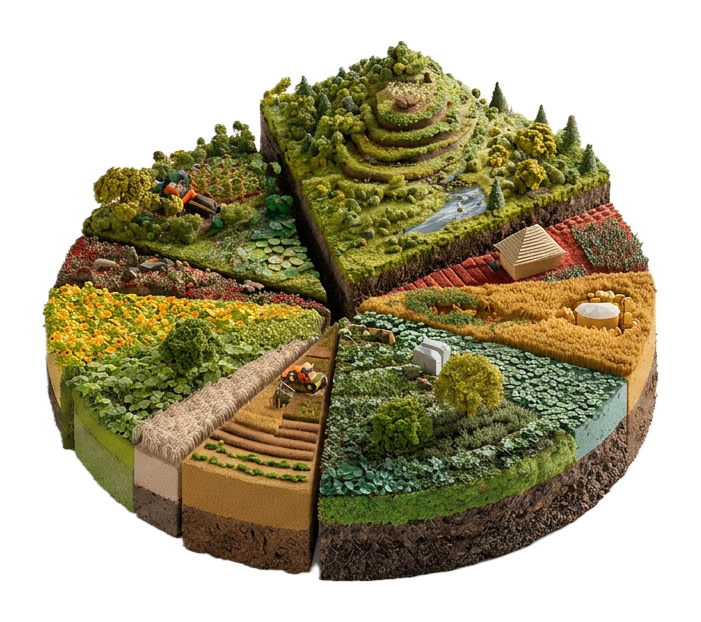
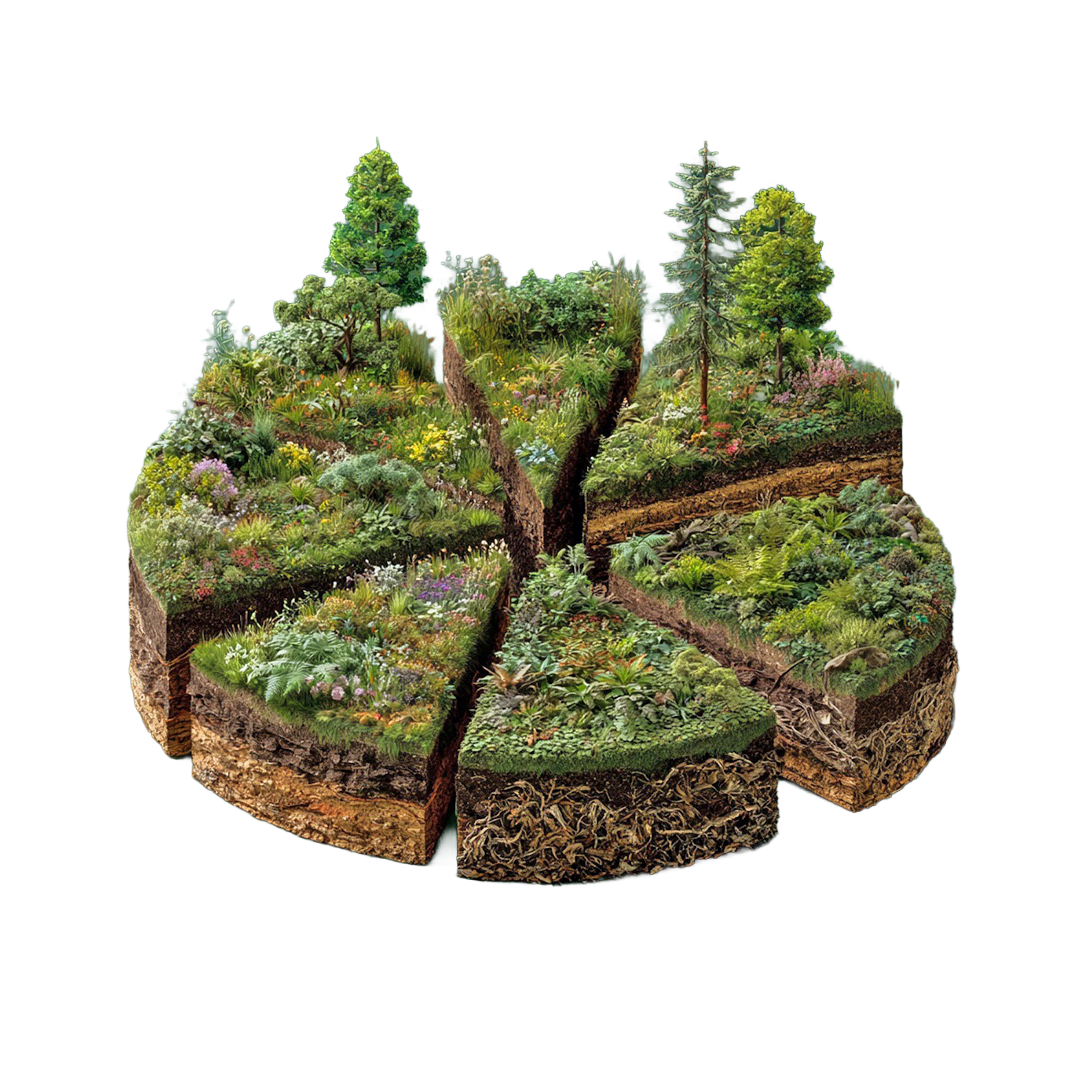
Living Soil
The ground beneath our tea, our coffee, our flowers and our food.
Net: Total depletion via soil degradation
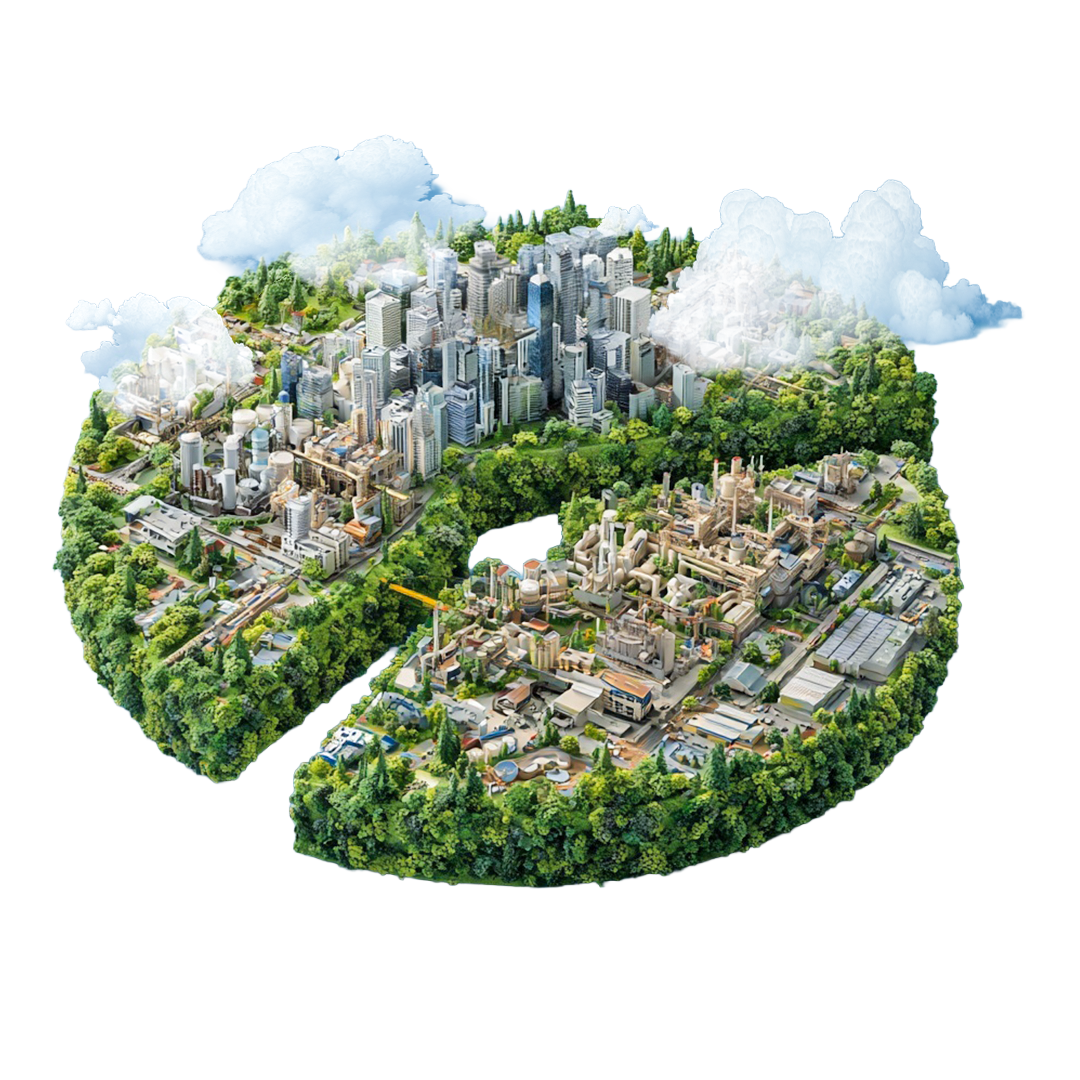
Climatic Stability
She gave us what creates a predictable economic environment and allows businesses to plan for tomorrow.
Net: Environmental impact driving climate volatility
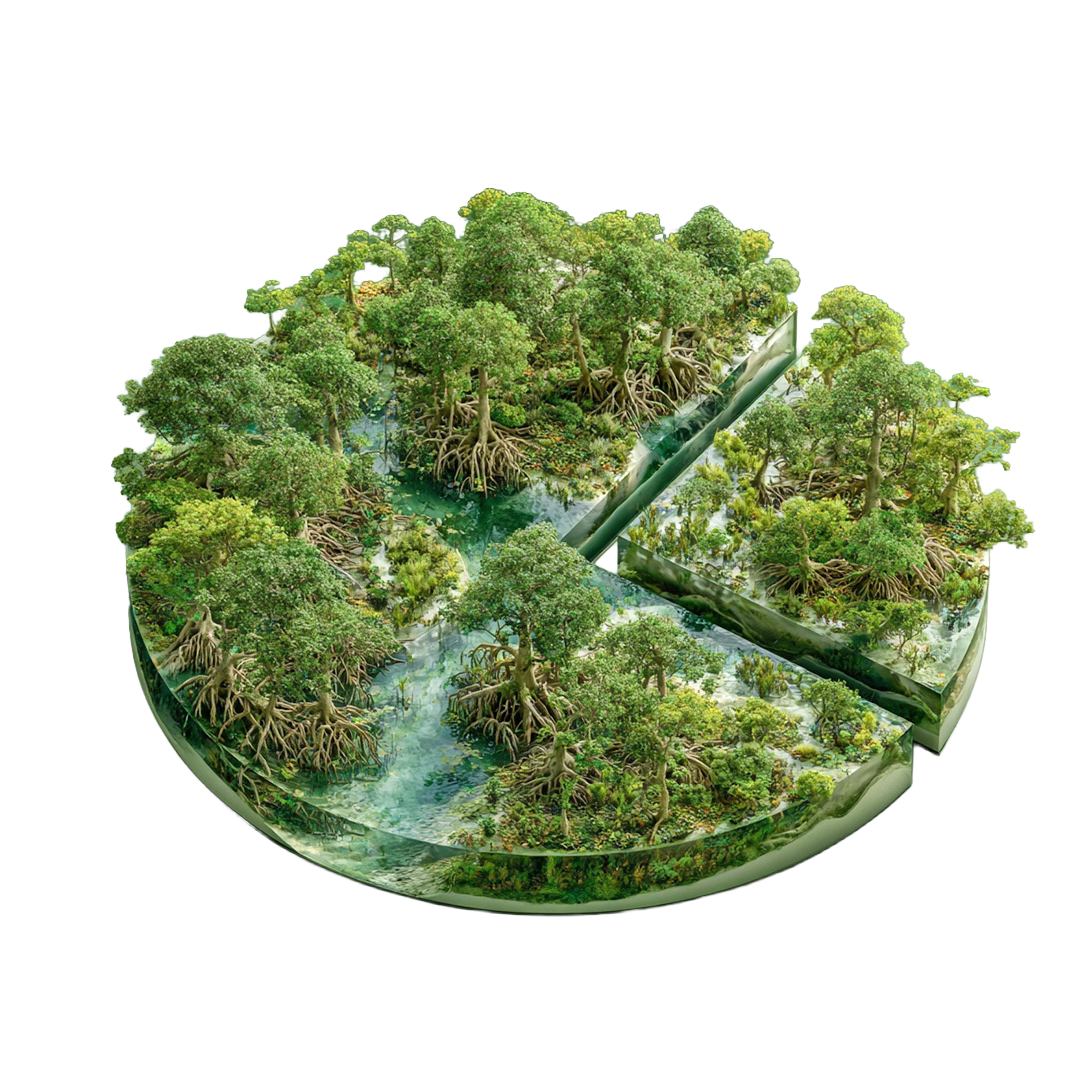
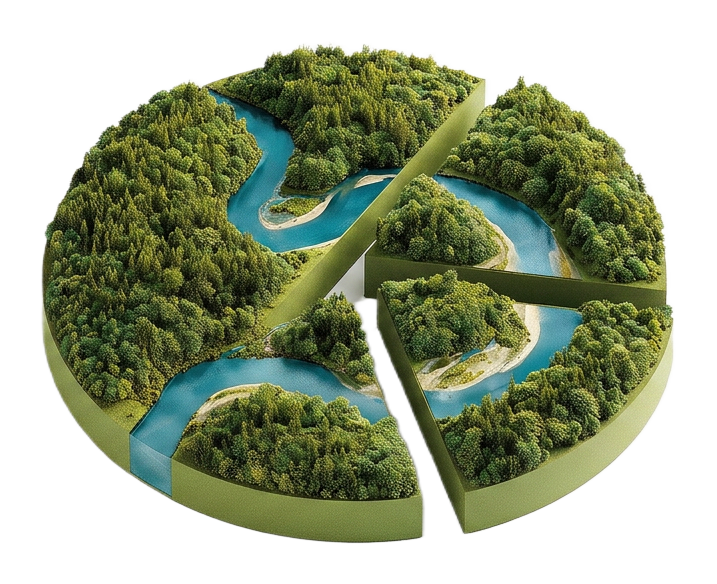
Flood Risk Management
Forests, wetlands and mangroves that absorb what infrastructure cannot.
Net: Overexploitation of protective forest cover
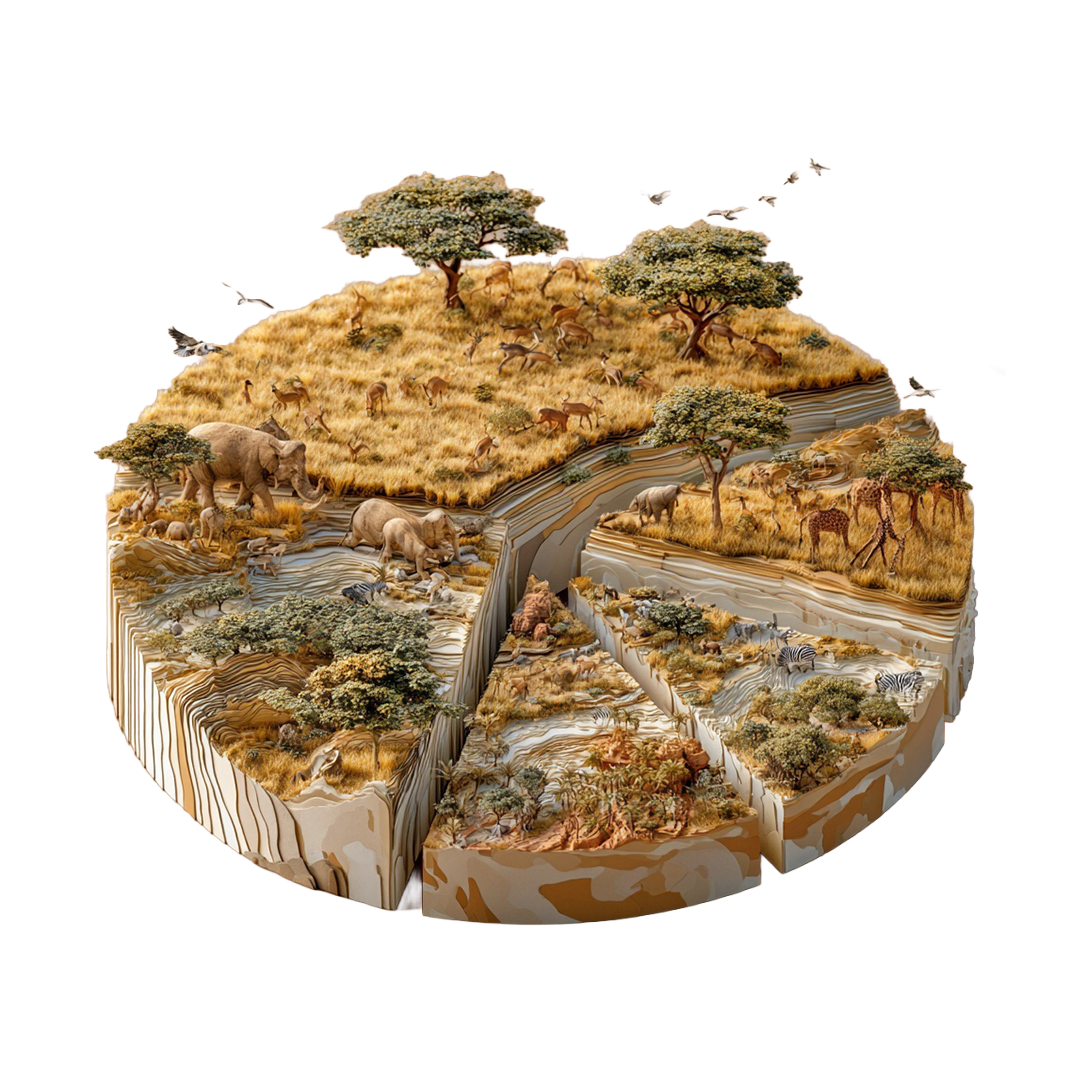
Disease & Zoonotic Risk
Biodiverse ecosystems that regulate pathogens before they reach the economy.
Net: Impact to biodiversity
Carbon & Climate Assets
Forests and soils that sequester what industry emits.
Net: Environmental impact from emissions imbalance
Fisheries
Lakes, rivers and ocean systems renewed stock at no cost to the operator.
Net: Overexploitation and mismanagement